Groq Represents a “Step Change” in Inference Speed Performance According to ArtificialAnalysis.ai
We’re opening the second month of the year with our second LLM benchmark, this time by ArtificialAnalysis.ai. Spoiler: The Groq LPU™ Inference Engine performed so well that the chart axes had to be extended to plot Groq on the Latency vs. Throughput chart. But before we dive into the results, let’s talk about the setup.
This benchmark is an analysis of Meta AI’s Llama 2 Chat (70B) across metrics including quality, latency, throughput tokens per second, price, and others. Groq joined other API Host providers including Microsoft Azure, Amazon Bedrock, Perplexity, Together.ai, Anyscale, Deepinfra, Fireworks, and Lepton.
Conducted independently, ArtifiicalAnalysis.ai benchmarks compare the hosting providers across key performance indicators including throughput versus price, latency versus throughput, throughput over time, total response time, and throughput variance. The benchmarks are ‘live’ meaning they’re updated every three hours (eight times per day) and prompts are unique, around 100 tokens in length, and generate ~200 output tokens. This test design is meant to reflect real-world usage and measures changes to throughput (tokens per second) and latency (time to first token) over time. ArtificialAnalyis.ai also has other benchmarks with longer prompts to reflect retrieval augmented generation (RAG) use cases.
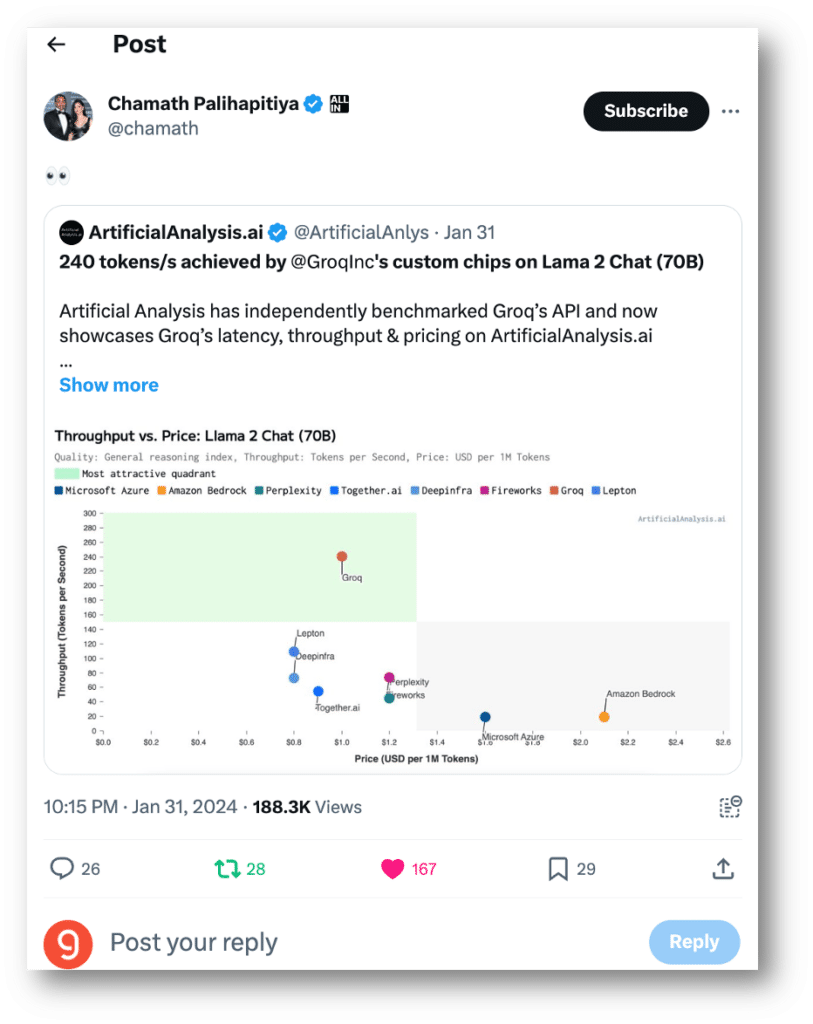
"ArtificialAnalysis.ai has independently benchmarked Groq’s Llama 2 Chat (70B) API as achieving throughput of 241 tokens per second, more than double the speed of other hosting providers. Groq represents a step change in available speed, enabling new use cases for large language models."
Micah Hill-Smith, Co-creator, ArtificialAnalysis.ai Repost
Results
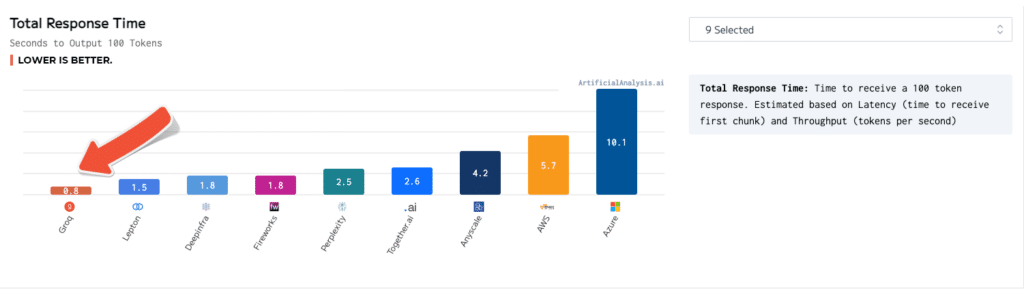
ArtificialAnalysis.ai benchmarks show Groq outperforming other providers in almost every category, especially regarding throughput and total response time to receive 100 output tokens, in which Groq delivered 241 tokens per second and 0.8 seconds, respectively.
Below is a closer look at some of the results.
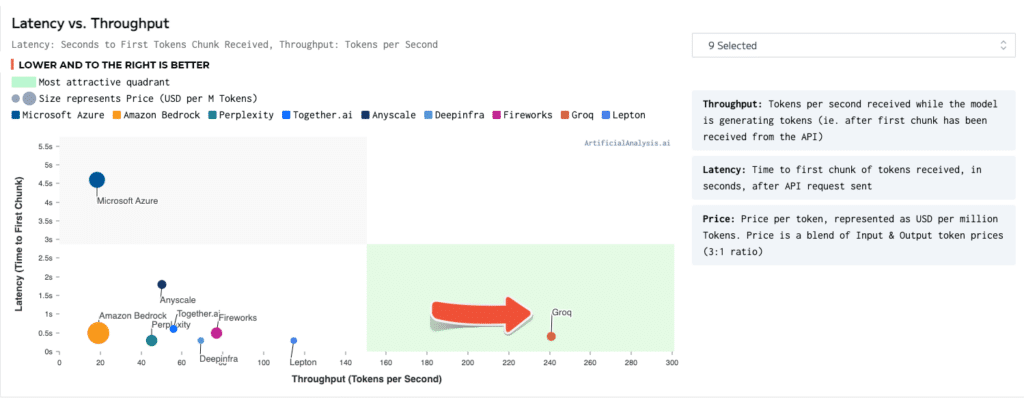
Latency vs Throughput
- Latency: Time to first tokens chunk received, in seconds, after API request sent
- Throughput: Token per second received while the model is generating tokens (ie after the first chunk has been received from the API)
- Lower and to the right is better, with the green representing the most attractive quadrant
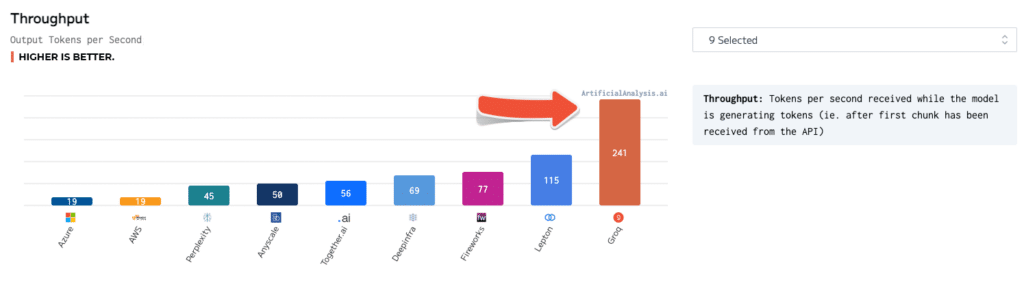
Throughput
- Throughput: Token per second received while the model is generating tokens (ie after the first chunk has been received from the API)
- Higher is better
Total Response Time
- Total response time: Time to receive a 100 token response, estimated based on latency and throughput
- Lower is better
“Groq exists to eliminate the ‘haves and have-nots’ and to help everyone in the AI community thrive. Inference is critical to achieving that goal because speed is what turns developers’ ideas into business solutions and life-changing applications. It is incredibly rewarding to have a third party validate that the LPU Inference Engine is the fastest option for running Large Language Models and we are grateful to the folks at ArtificialAnalysis.ai for recognizing Groq as a real contender among AI accelerators.”
Jonathan Ross, CEO & Founder of Groq Repost
The LPU Inference Engine is available GroqCloud™, which offers multiple levels of API access. Learn more here.